
Goodbye, chartjunk!
Whenever I need a chart, I die a little inside. It's not that I don't like charts - au contraire - I love them. It just seems that that all applications that are supposed to help you make charts... well, they suck. Either they're really user-unfriendly and/or they produce absolutely godawful charts. Most likely both.
By the way, the same goes for chart-related programming libraries. I've tried a few.
Well. Apparently the peeps at Google just stepped into the game, with the Google Chart API. Basically, you craft a URL with all the data and styling information, and they'll hand you a chart, as a PNG image.
Not long ago, I spent half a day in OpenOffice and the GIMP - two of the most frustrating applications on my computer - to make a chart of PC sales in Sweden between 2005 and 2007 (including a little estimation for the last quarter of 2007). It really did take half a day, and here's what I came up with:
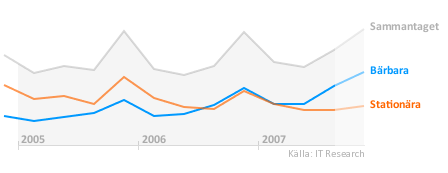
And something roughly equivalent that I just whipped up with the chart API:
There are limitations, of course, but for most applications when you just want the damn chart, without junk, this will be quite good enough.
See the Developers Guide for all the details.